


Music Trades Data Subscriptions

Sign Up for Annual Data Packages and Access 100+ Years of Back Issues
New data subscription options deliver a year’s worth of Music Trades reports bundled at a cost-effective rate. Subscribe to get the newest reports the moment they’re released.

Just Released:2026 Industry Census Report – Sales Slow As The Industry Faces $627 Million Tax Bill
Just as the supply COVID chain disruptions were fading from memory, chaotic tariff policies sowed uncertainty and handed the industry a $627 million tax bill. Any wonder that sales trended down? The Music Products Industry as defined by this report includes the full range of musical instruments-frets, winds, keyboards, printed music, and percussion—along with professional audio products designed for live sound applications, multi-track recording software, DJ and sound creation tools, and a host of related accessories. The estimated U.S. retail value these products declined 0.8% to $8.2 billion in 2025, from the $8.3 billion level in 2024.
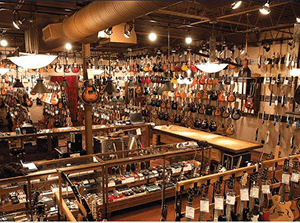
Just Released:Sales Decline A Modest 0.5% In the 3rd Quarter
Interest rate hikes, an absence of new products, and flagging consumer confidence hold back the market
The third quarter produced a confusing picture for U.S. music retailers. On the surface, sales remained surprisingly resilient, given higher gas prices and other inflationary pressures, declining a negligible .5% to $1,746,675,000 compared to $1,755,584,000 in the same period one year ago. For the first nine months of 2026, sales were virtually flat at $4,245,257,000 compared to $4,245,878,000 last year. Behind the headline numbers, though, a noticeable change in consumer behavior was becoming increasingly evident: shoppers were still spending, but they were becoming much more selective in their spending. A retailer from Atlanta explained, “The consumer’s preference for buying direct from manufacturers and from the retail giants like Amazon, Sweetwater and Guitar Center seems unstoppable. We’re pulling out all the stops but it’s …..

Just Released:Ranking The World’s 225 Largest Music Manufacturers
Industry Revenues Are Limited By Absence Of Major Innovations
In 2025, the aggregate volume of music products sold in the world’s leading markets was essentially unchanged at $17.7 billion. Having trended down over the past five years from the COVID-era high-water mark of $19.5 billion, revenues appear to have stabilized. Slowing global population growth and tepid economic growth shoulder some of the blame for the industry’s relative stagnation. However, the primary culprit has been the absence of any major product advances. In every category—audio, frets, electronic music, recording, winds, and percussion—product advancement has been evolutionary rather than revolutionary, providing less impetus to for consumers to buy...…

Just Released:2026 EDITION Global Music Products Top Retail Report
Performance among the top ranked retailers varied dramatically
This report ranks 237 of the world’s leading music products retailers by estimated 2025 revenue. The roster includes businesses operating in 49 countries and on five continents. While it is not a comprehensive listing, the businesses ranked account for close to 70% of the industry revenues outside of the United States and represent the leading players in their respective countries. Retailers operating in the U.S. market are excluded from this report; however, a ranking of the largest 100 retailers worldwide on page 8 does include leading U.S. companies. 2025 could be characterized as a year of negligible outward change. Aggregate revenues for the top Global retailers were $7.34 billion, up 1.8% from the prior year…..
Featured Data Reports

Complete Music Industry Sales Report: 2026 Edition
Find detailed sales statistics on all music and sound equipment: 55 different categories, average unit prices, sales by price point, unit volume, retail and wholesale margins, year-to-date, and 10-year historical data.

The State of the Online Retail Marketplace: 2026 Edition
The top 50 online music retailers worldwide, ranked by revenues – plus contact information, base country,employee count, products carried, and year-to-year trends. Five years of data included.
Complete Data

Top 100 Suppliers Report
The 100 leading U.S. music companies ranked by the most recent full-year revenues. Also included: employee count and chief executive for each ranked company, plus complete analysis. Excel version includes company contact information and ten years of data.

Top 200 Retailers Report
The 200 leading U.S. music retailers ranked by the most recent full-year revenues. Also
included: employee and store counts, productivity statistics, products carried, and year-to-year trends – plus complete analysis. Excel version includes company contact information and five years of data.

Global 225 Report
This two-part report includes: 1) A list of the leading 225 music companies around the world, ranked by the most recent full-year revenues – plus employee count, CEO, base country, and web address for each. 2) Basic sales and demographic data on 47 countries where music products are sold. Includes complete analysis.
Excel version includes two years of country data and five years of company data.

Music Industry Census Report
Comprehensive U.S. data on 55 product categories across the music products industry. Find ten years of figures showing sales by unit volume, wholesale and retail value, average unit price, and year-to-year trends. A complete analysis is included.

Buy All Four
The best price on Music Trades’ four most popular reports: the Music Industry Census, Top 100 Suppliers Report, Top 200 Retailers Report, and Top 225 Global Report.

International Dealer Sales Report
Find sales and company data – including revenues plus employee and location counts – for 327 leading retailers in 58 countries where music products are sold. Includes complete analysis and company profiles on standout retailers around the world. The Excel version includes contact information and market data by country.

Quarterly Retail Sales Report
A snapshot of the latest U.S. sales in 15 music product categories, plus regional data, analysis, and trends going back eight quarters.

Import Tracker
The most recent quarter’s import figures for key music product categories by product type, price point, and country of origin, plus year-to-year trends and analysis.

The State of the Online Retail Marketplace
The top 50 online music retailers worldwide, ranked by revenues – plus contact information, base country, employee count, products carried, and year-to-year trends. Three years of data included.

2026 Accessory Market Analysis
This all-new report presents three years of data on U.S. retail and wholesale volumes for all key musical instrument and audio accessories that collectively accounted for over $1.2 billion in retail sales in 2025.